FinancialServicesFirmGetsReal-TimeAnalyticsDashboard
How Techseria built a real-time financial analytics dashboard replacing static spreadsheet reports, giving advisers and management live access to portfolio and operational data.
Key Benefits
How Techseria built a real-time financial analytics dashboard replacing static spreadsheet reports, giving advisers and management live access to portfolio and operational data.
- Real-time: Dashboard
- Live: Data Feed
- 14 weeks: Development
The Challenge
A financial services firm relied on static spreadsheet reports that were compiled manually by analysts and distributed on a scheduled basis. Decision-makers had no real-time access to current data, report preparation consumed significant analyst time each week, and the lack of interactive drill-down capability limited how the data could be interrogated.
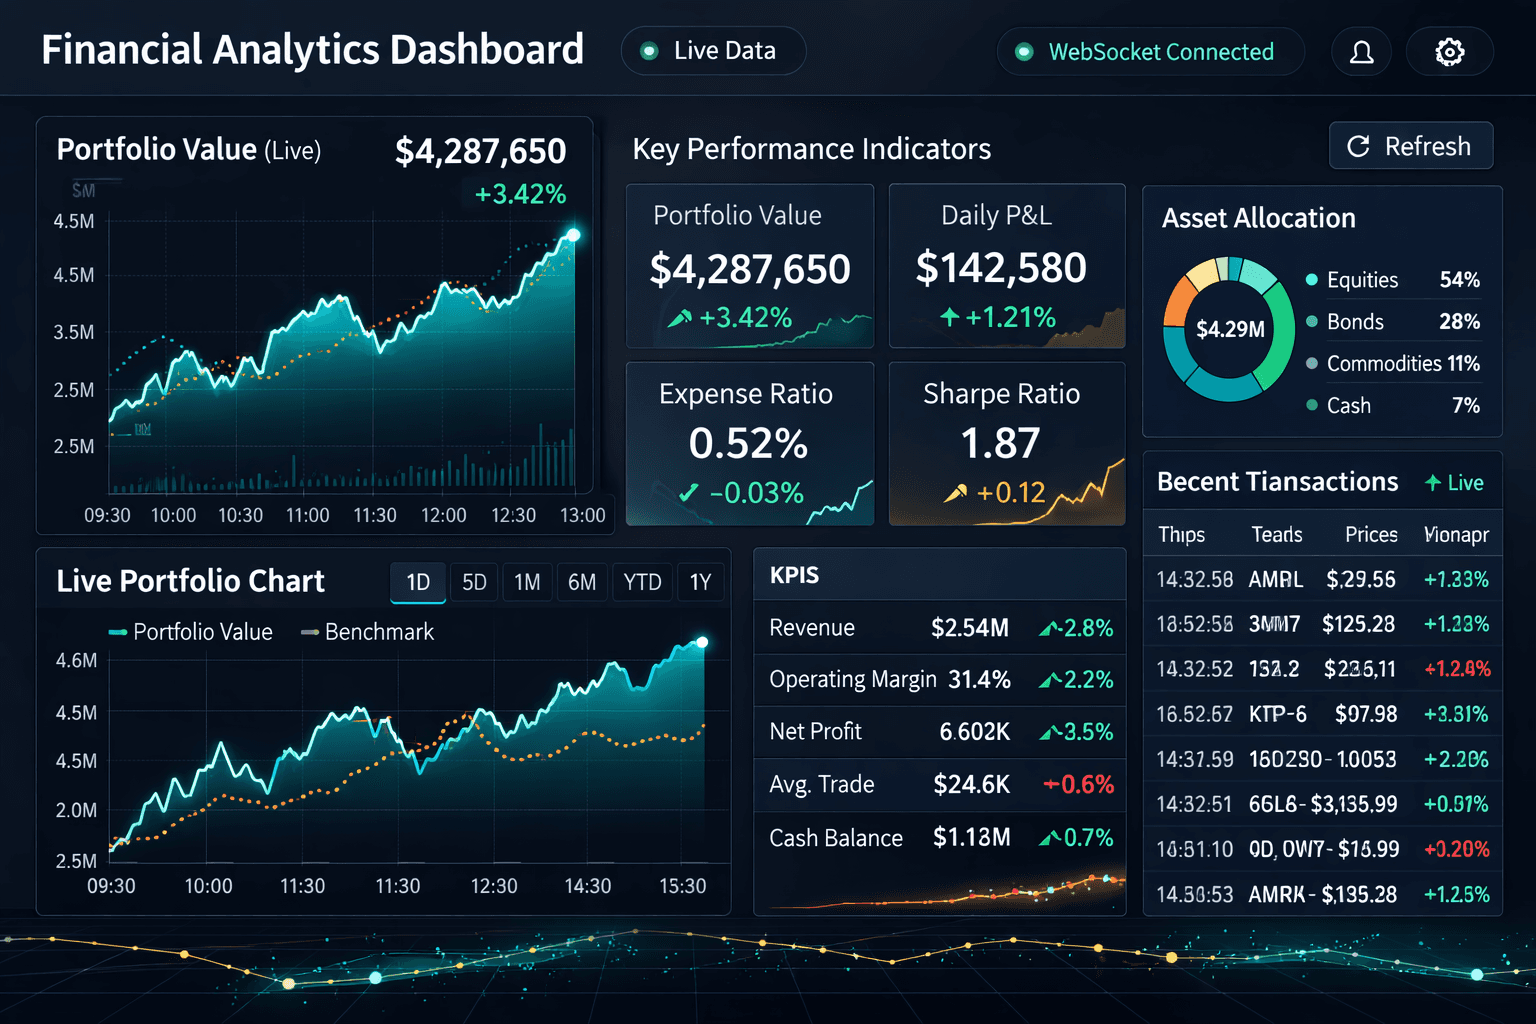
The Solution
Techseria built a real-time analytics dashboard using Node.js backend with React frontend, WebSocket connections for live data updates, and D3.js and Highcharts for data visualisation. The platform integrated with the firm's data sources to provide live portfolio views, operational metrics, and management reporting — replacing the manual spreadsheet compilation cycle.
Results
How Techseria built a real-time financial analytics dashboard replacing static spreadsheet reports, giving advisers and management live access to portfolio and operational data.
- User Engagement: Higher - Live interactive dashboards replaced static reports, increasing daily platform usage among advisers and management.
- Dashboard Sessions: Increased - Self-service access to current data reduced the need for analysts to produce and distribute scheduled reports on request.
- Analyst Time Monthly: Saved - Automated data refresh eliminated the weekly manual report compilation process.
- Data Entry Errors: Reduced - Direct system integration removed the manual data transfer step that introduced errors into spreadsheet reports.
- Decision Making: Faster - Real-time access to current data reduced the lag between operational events and management awareness.
- User Adoption: Improved - Interactive, well-designed dashboards had higher usage rates than the previous static report distribution.
- Training Time: Reduced - Intuitive interface design reduced the time required to onboard new users to the analytics platform."
- Data-Driven Decisions: More - Management decisions informed by current data rather than reports reflecting a previous period.
- NodeJS
- ReactJS
- WebSockets
- D3.js
- Highcharts
Technologies Used
Client Voice
"Techseria's financial analytics dashboard has transformed how our client processes and utilizes data for decision-making. The real-time capabilities are truly effective—what previously took hours now happens instantly, providing a crucial competitive edge in fast-moving financial markets. The intuitive interface has democratized data access across the organization; we're seeing executives engaging with analytics who previously avoided the data altogether. Most impressively, the customization capabilities have allowed different departments to create dashboards specifically tailored to their unique needs without requiring technical support. The impact on both operational efficiency and strategic decision-making has exceeded all expectations."