

Reduce Your Factory Electricity Bill: Find Idle Energy, Compressed-Air Leaks and Energy per Piece
At lunch the lines stop, but the compressors keep running at 60% load. Air is leaking somewhere. Nobody sees it, because on the bill it is just "energy".
A simple test tells you a lot: what does your plant consume on a Sunday when nothing is running?
In short: Most avoidable energy waste hides in three places: machines drawing power while idle, compressed air leaking when production is stopped, and energy per unit drifting upwards as equipment degrades. Measure energy per machine against production, price idle consumption at your tariff, and compare against a production-normalised baseline, so real savings are not confused with lower output.
Why energy waste is invisible
- One bill, one number. The monthly bill tells you how much, not where, when or why.
- Idle running looks like production. A machine drawing power between jobs, or a compressor at load during lunch, is indistinguishable from useful work on the bill.
- Compressed air is the most expensive utility nobody meters. Leaks run 24 hours a day.
- Energy per piece drifts slowly. A motor or pump that is degrading draws more power for the same output, a little more each week.
- Savings are hard to prove. If the plant produced less this month, energy fell too, and someone will claim it as a saving.
How to find and cut energy waste
1. Meter by machine or line
Put the biggest consumers on their own channel: compressors, furnaces, chillers, large presses, extruders.
2. Measure energy per unit of output
Specific energy consumption (SEC), such as kWh per piece, kg or metre, is the only fair comparison between shifts, lines and products.
3. Declare the engineered idle floor
Every machine has a minimum draw when idle. Anything above that floor while the machine is idle or stopped is waste you can price.
4. Check compressed air when production is zero
Compressor load during breaks, weekends or shutdowns is a direct leak indicator. Track specific power (kW per unit of air flow) as well.
5. Use a production-normalised baseline
Fit energy against output over a "before" period, so a saving is measured at the output actually produced.
6. Do not forget water and diesel
Unaccounted-for water and DG fuel issued against expected consumption are often the next-largest utility leaks.
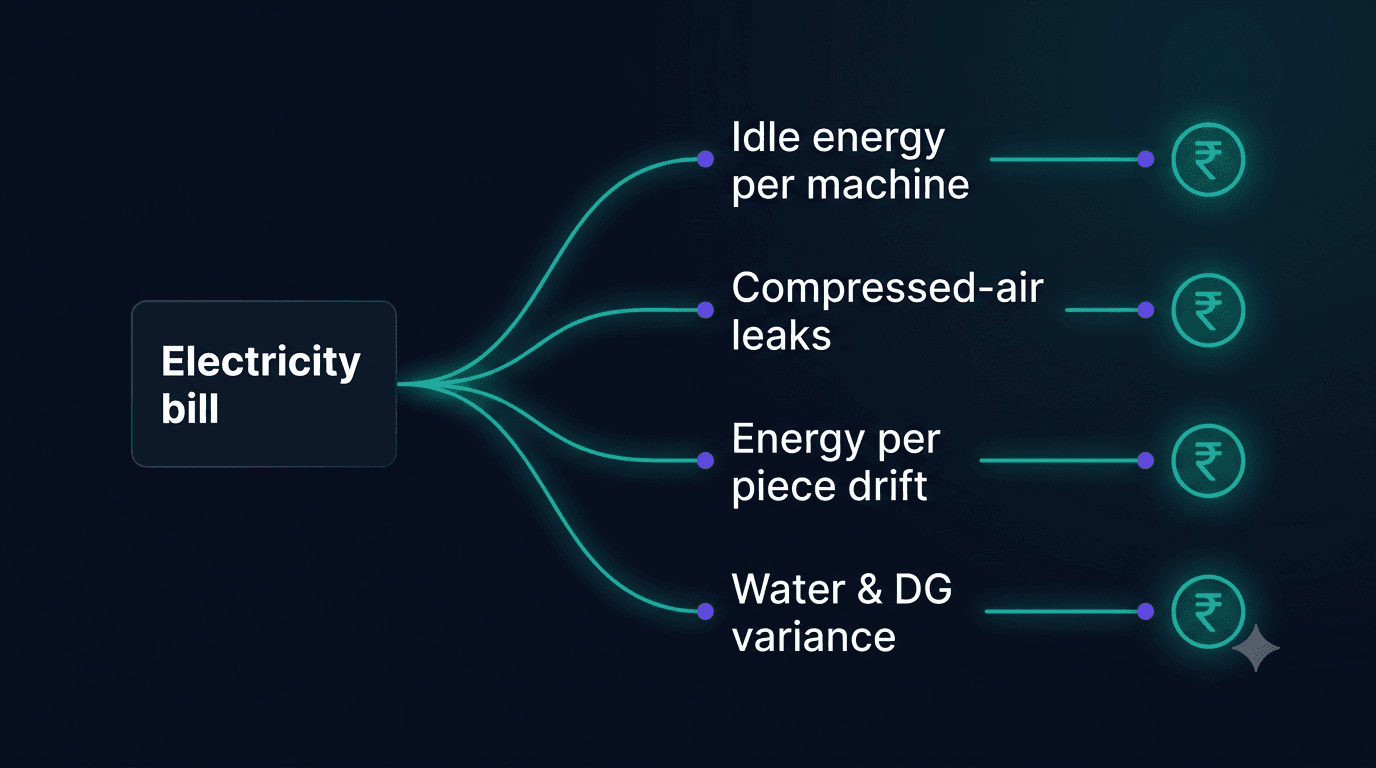
How MIRA turns "energy" into a list of actions
MIRA, Techseria's AI plant-intelligence platform, prices every kind of energy waste.
- Machine Energy: specific energy consumption (kWh per piece, metre or kg) for each machine, line and plant, with drift detection.
- Idle energy: energy drawn while a machine was idle or stopped, above the declared engineered floor, priced per machine per shift.
- Compressed air: compressed-air specific power, plus an air-leak indicator from compressor load when production is zero.
- Energy as a condition signal: rising kW at constant output is flagged as possible asset degradation.
- Best operating point per product: the settings in force during the best SEC and OEE windows that met quality.
- Water and DG fuel: unaccounted-for water percentage and DG fuel issued against expected consumption, shown as a variance to investigate, never as an accusation.
- Energy baselines: a production-normalised baseline, so a saving is not booked just because the plant produced less. Savings go to your engineer for approval.
- Reports: daily and monthly energy reports by hierarchy, top consumers, maximum demand, power factor, SEC and idle energy.
Energy stops being one number on the bill. It becomes a list of machines, shifts and leaks with a rupee figure beside each.

What you need
Power channels per machine or line, air-flow meters for compressors, and production counters. Idle floors and tariff declared on screen. BMS or CSV feeds for water and DG fuel.
Frequently asked questions
What is specific energy consumption (SEC)?
SEC is energy used per unit of output, such as kWh per piece or per kg. It lets you compare energy efficiency across shifts, products and lines fairly.
How can I detect compressed-air leaks without an ultrasonic survey?
Watch compressor load when production is zero. If compressors are loaded while nothing is using air, the difference is largely leakage. An ultrasonic survey then helps you find the exact points.
How do I prove an energy saving is real?
Compare against a baseline fitted to production output over a "before" period. Otherwise a quiet month looks like a saving.
What does your plant use on a Sunday?
See MIRA's energy screens or book a demo and bring one month of meter data.
See MIRA on Your Own Plant Data
Bring a month of work orders, a meter export or a PLC tag list. We'll show you what MIRA finds, and what it needs to find more. Unlimited users and assets, installed inside your network.
Ready to accelerate your operations?
See how custom AI solutions, ERPNext integration, and workflow automations can lower your operating costs. Book your free 30-minute Workflow Audit with a senior engineer.