
The Same Failure, Again and Again: How to Stop Repeat Equipment Breakdowns With Root Cause Analysis
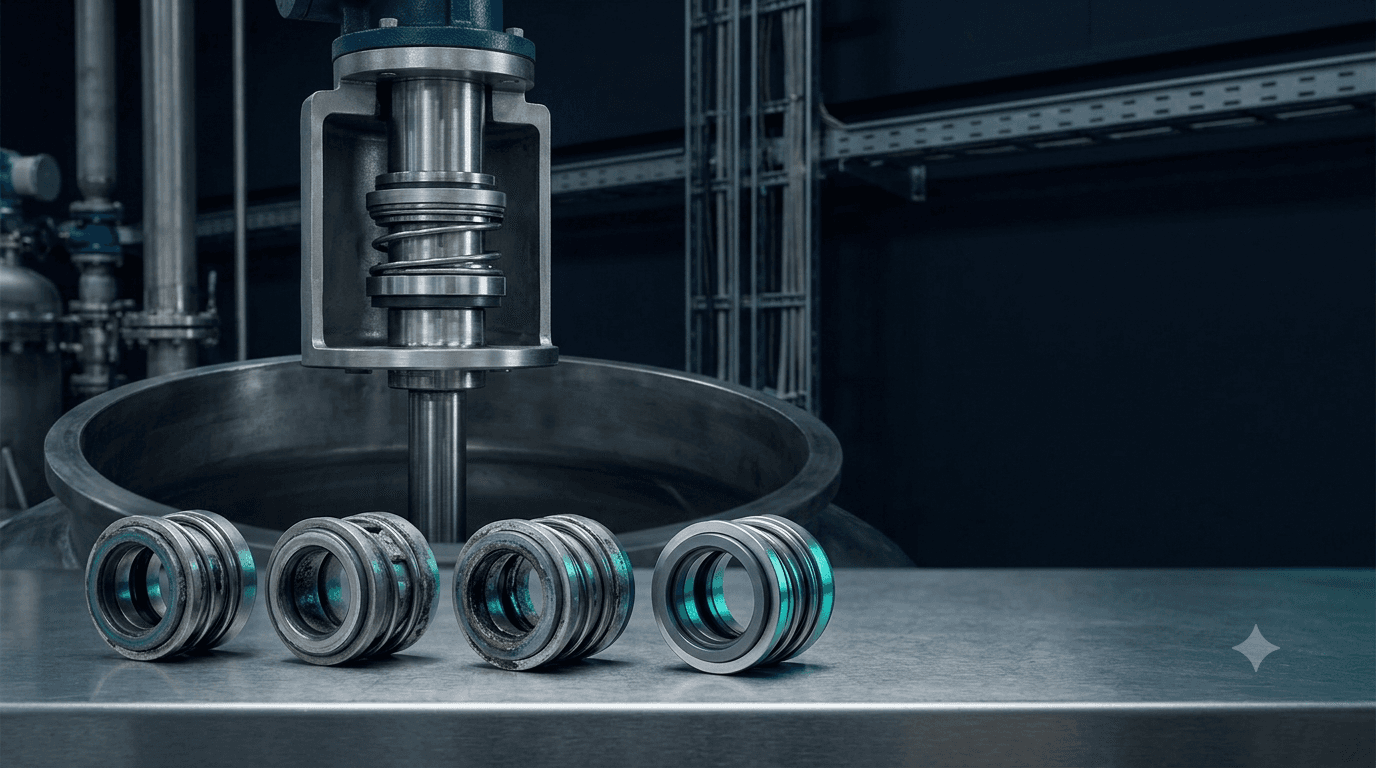
The agitator seal on reactor R-3 fails again. The technician replaces it and closes the job in ten minutes. Nobody connects it with the three failures before it. Each one was "just a seal".
By the end of the year, the plant has paid for four seals, four sets of labour, four production interruptions, and at least one emergency purchase. And the cause is still there.
In short: Repeat failures continue because each work order is closed in isolation and described in free text. To stop them, count failures per asset and failure mode using a fixed vocabulary. Test whether failures are coming faster. Then change the design, the operating practice or the PM task that should have guarded against the failure, and confirm that a PM task now covers it.
Why repeat failures stay invisible
- Every job is closed on its own. The work-order system records what was done today, not how often the same thing happened this year.
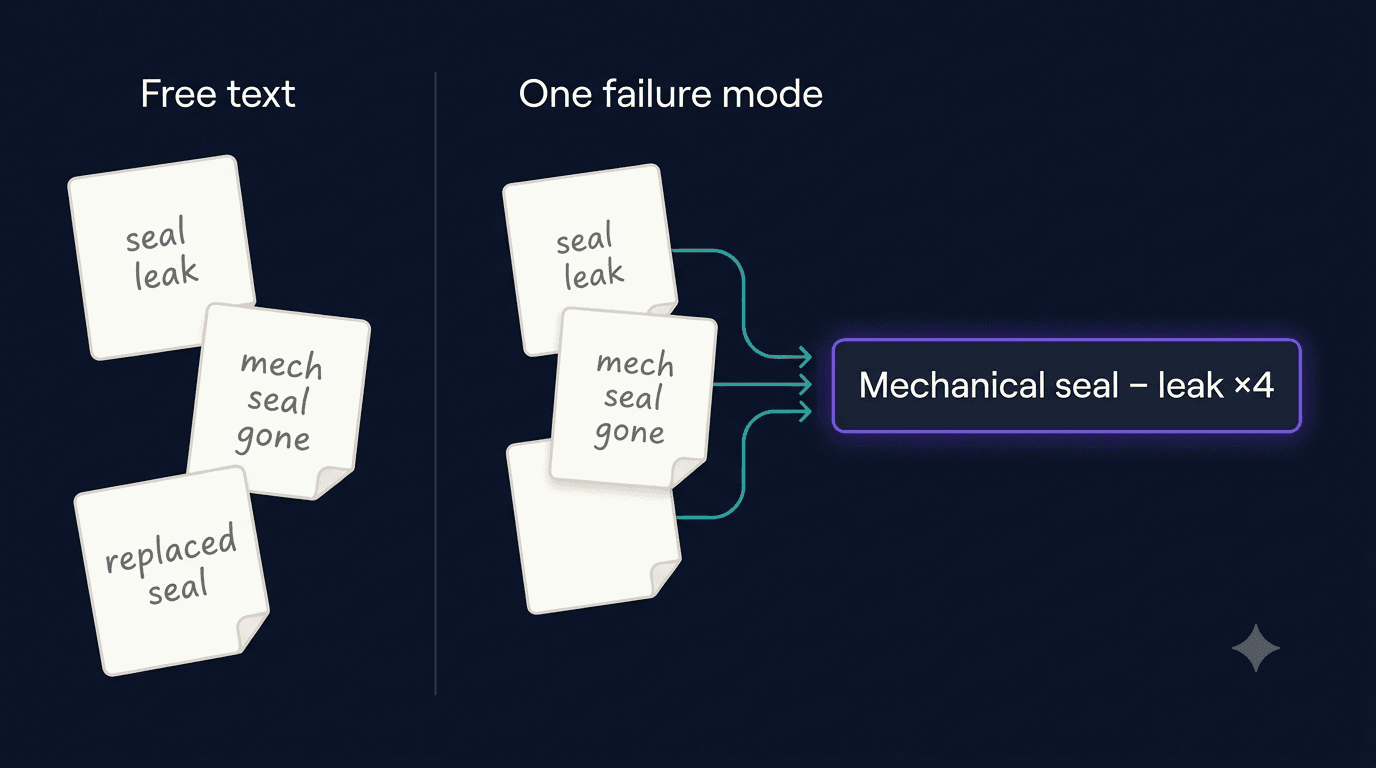
- Free-text descriptions hide the pattern. "Seal leak", "mech seal gone" and "replaced seal" are the same failure, but a spreadsheet counts them as three different things.
- RCA is a meeting that never gets scheduled. Root-cause analysis needs someone to collect the history first. That takes days, so it rarely happens.
- The fix never reaches the PM plan. Even when a team finds the cause, the lesson stays in someone's head instead of becoming a PM task.
How to find and fix your bad actors
1. Pull 12 to 24 months of work-order history
You need the equipment, the date and a description for each corrective job. Excel exports from SAP, FacilityFlow or any CMMS are enough.
2. Normalise the failure description
Map every free-text description to a controlled failure mode and component, such as "mechanical seal – leak". This single step usually reveals more repeat failures than any analytics tool.
3. Rank assets by repeat count and cost
Sort by the number of repeat failures per asset and failure mode, then by cost and downtime. The top ten lines are your bad actors.
4. Test for a trend before fitting a life curve
If failures are coming faster, the asset is deteriorating and a standard Weibull life curve will mislead you. Test for a trend first. Fit a Weibull only when failures show no trend.
5. Fix the cause and guard it with PM
The fix may be a different seal type, an alignment check, a lubrication change or an operator practice. Record it in your FMEA and make sure a PM task now guards against that failure mode.
How MIRA makes repeat failures visible
MIRA, Techseria's AI plant-intelligence platform, does the history work that usually stops RCA from happening.
- The Root Cause Analysis agent finds recurring failures across your work-order history automatically.
- A controlled failure-mode and component vocabulary means "seal leak", "mech seal" and "seal gone" are counted as one thing.
- Asset 360 shows every job, health change and reason on one timeline per asset.
- Weibull life analysis tests for a trend first. It fits a Weibull only when failures show no trend, with at least 4 failures and 5 intervals. A deteriorating asset gets "trend found", not a misleading curve.
- FMEA studies are guided in eight stages. MIRA mines your work-order history for occurrence, the AI drafts rows, and your engineer reviews, scores and approves them.
- PM Coverage then shows which failure modes no PM task guards, and which PM tasks are redundant.
The result: the fourth failure is the last one, and the reason is written down for the next engineer.

What you need
Work-order history with the equipment and a description, from Excel, SAP or FacilityFlow. That is enough to find repeat failures. An approved FMEA study unlocks PM coverage and strategy recommendations.
Frequently asked questions
What is a "bad actor" in maintenance?
A bad actor is an asset that fails repeatedly and consumes a disproportionate share of maintenance cost and downtime. In most plants, a small number of assets account for most corrective work.
How much data do I need for Weibull analysis?
MIRA needs at least 4 failures and 5 intervals, and it tests for a trend first. With less data, it says so rather than drawing an unreliable curve.
Can AI do root cause analysis for us?
AI can find the pattern, count the failures and draft FMEA rows from your history. The engineering judgement about the real cause and the right fix stays with your reliability engineer, who approves every row.
Which asset do your technicians joke about?
Every plant has one. It is always the same job. See how MIRA finds it or book a demo with your own work-order export.
See MIRA on Your Own Plant Data
Bring a month of work orders, a meter export or a PLC tag list. We'll show you what MIRA finds, and what it needs to find more. Unlimited users and assets, installed inside your network.
Ready to accelerate your operations?
See how custom AI solutions, ERPNext integration, and workflow automations can lower your operating costs. Book your free 30-minute Workflow Audit with a senior engineer.