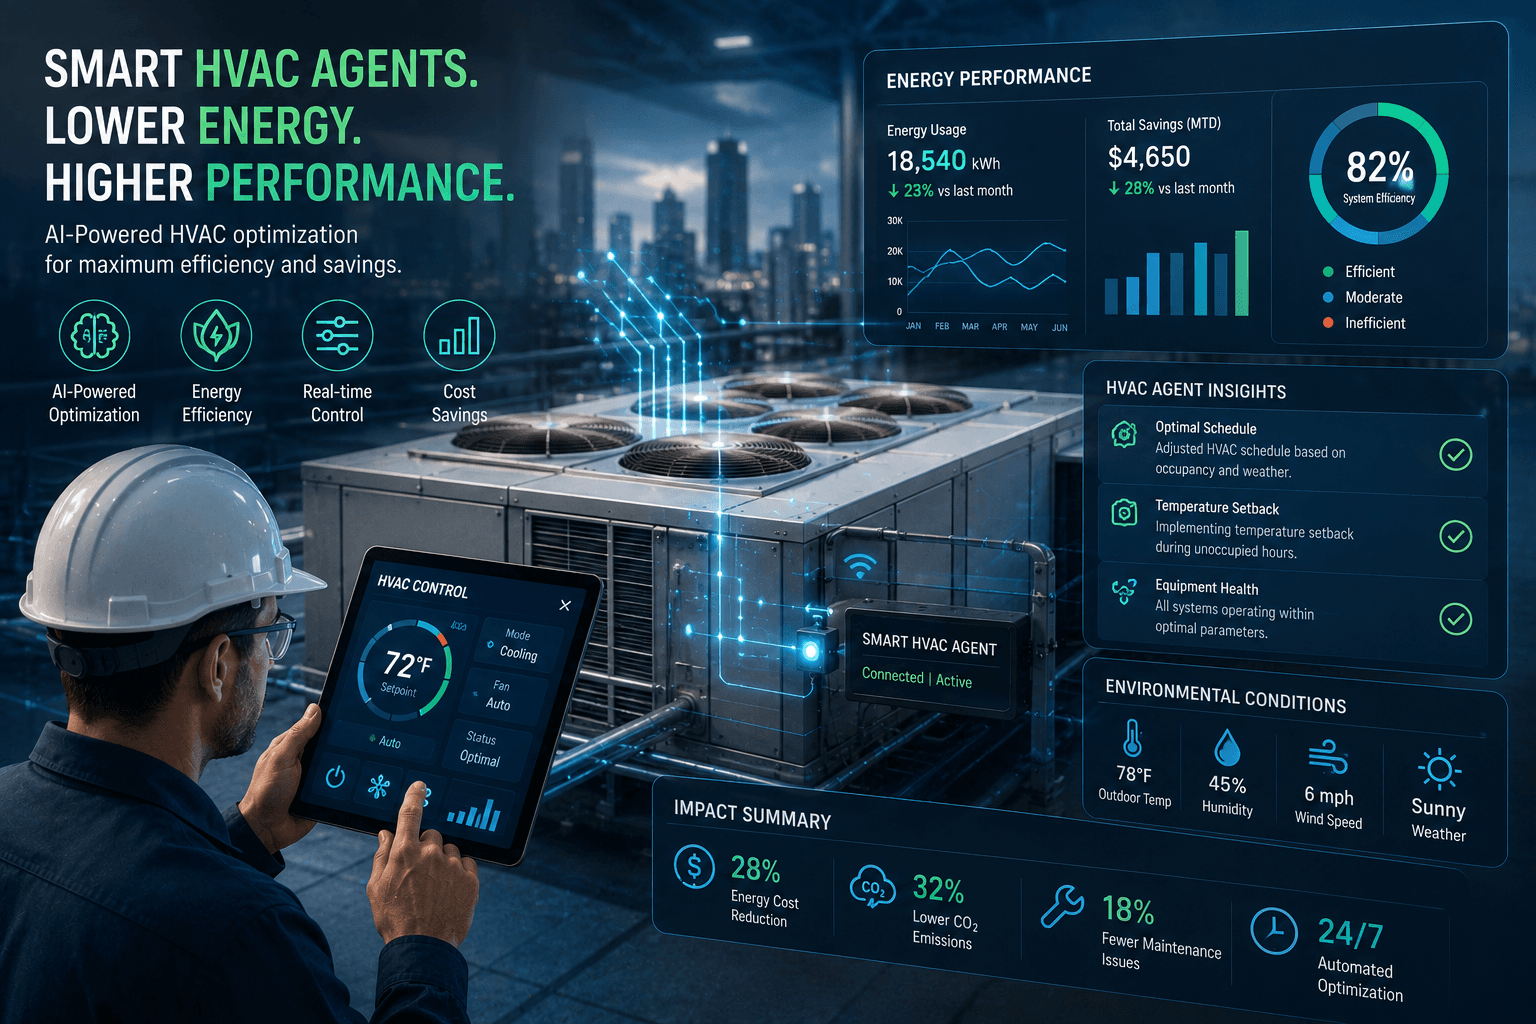
Energy is usually one of the largest running costs in a building, and across an estate of many sites it is also one of the hardest to keep track of. Bills arrive from different suppliers, meters are read at different times, and a sudden jump at one site can go unnoticed for weeks.
Cutting waste starts with seeing it. This article looks at the estate-level side of energy and sustainability: how to keep your utility data in one place, close each month cleanly, and report on carbon and green building targets without a scramble.
One register for every meter and bill
Start with a monthly utility consumption register for electricity and water. The figures may come from a utility bill, a private meter, a grid meter or a building management system, but they should all land in the same place. When each site records data in its own spreadsheet, comparing them takes days and mistakes slip in.
FacilityFlow keeps a monthly utility register and retains 36 months or more of history, so you can look back across seasons and years. It also raises missing-data alerts, so if a site forgets to submit a reading you hear about it before the month ends rather than after.
A single register also makes handovers easier. When a new energy champion or site engineer joins, they can see the history of every meter without hunting through old emails and folders.
Rate cards and the monthly close
Raw consumption only tells half the story. To understand cost, you need the tariff. FacilityFlow supports rate cards with rate details, and it calculates consumption, rate, cost and carbon emissions from them. That means the same reading gives you a kilowatt-hour figure, a cost figure and an emissions figure.
A monthly utility close then gives the process a clear finish line. Once readings are complete and checked, the month is closed and the figures are ready for reports. A scheduled job runs the carbon calculation each month, so nobody has to remember to start it.
Spotting spikes and drops
Where meters or a BMS feed readings into the system, FacilityFlow can detect trend anomalies and energy spikes or drops. A site that suddenly uses far more than its usual pattern, or one that drops to almost nothing because a meter has failed, is flagged for review. Telemetry can come in through MQTT or REST ingestion, with profiles for protocols such as BACnet, Modbus, OPC UA, SNMP and KNX, along with thresholds and alerts.
The point is not to replace a technician's judgement. It is to make sure the right person looks at the right site sooner.
Carbon, green building targets and renewables
Sustainability reporting is easier when it grows out of the same data. The carbon footprint calculator uses emission factors per country, fuel consumption and an indirect emissions log, and the Energy and Sustainability dashboard shows tonnes of CO2 equivalent, split into direct and indirect emissions and filtered by project, site and month.
If your buildings pursue BCA Green Mark or LEED, FacilityFlow tracks them too. Green Mark buildings are mapped to job sites, with building records, indicators, a records register and a status register, plus a Green Mark Building Dossier you can print. LEED compliance tracking, water efficiency measures and waste management metrics sit alongside. For sites with solar, you can compare PV produced against consumed.
Comparing sites across the portfolio
Once every site reports in the same way, you can compare them fairly. Portfolio views and energy intensity figures help you see which buildings use more than their peers, so you can decide where to investigate first. Water and waste records add to the picture, since a leaking tank or an overflowing skip is also waste.
Printing a meter QR label for each energy meter is a small thing that helps too. A technician can scan it on site and be sure the reading belongs to the right meter.
How FacilityFlow helps
FacilityFlow brings meters, rate cards, the utility register, carbon reporting, Green Mark and LEED tracking, and maintenance work orders into one integrated facility management platform. When an alert points to a problem, the fix can be raised as a job in the same system. There are unlimited users and no per-seat fees, so site teams, engineers and sustainability staff can all work from the same data.
If you would like to see how this could look across your own estate, book a demo and we will show you the utility register, the monthly close and the sustainability dashboard.
